Article Text

Abstract
Background Digital phenotyping methods present a scalable tool to realise the potential of personalised medicine. But underlying this potential is the need for digital phenotyping data to represent accurate and precise health measurements.
Objective To assess the impact of population, clinical, research and technological factors on the digital phenotyping data quality as measured by rates of missing digital phenotyping data.
Methods This study analyses retrospective cohorts of mindLAMP smartphone application digital phenotyping studies run at Beth Israel Deaconess Medical Center between May 2019 and March 2022 involving 1178 participants (studies of college students, people with schizophrenia and people with depression/anxiety). With this large combined data set, we report on the impact of sampling frequency, active engagement with the application, phone type (Android vs Apple), gender and study protocol features on missingness/data quality.
Findings Missingness from sensors in digital phenotyping is related to active user engagement with the application. After 3 days of no engagement, there was a 19% decrease in average data coverage for both Global Positioning System and accelerometer. Data sets with high degrees of missingness can generate incorrect behavioural features that may lead to faulty clinical interpretations.
Conclusions Digital phenotyping data quality requires ongoing technical and protocol efforts to minimise missingness. Adding run-in periods, education with hands-on support and tools to easily monitor data coverage are all productive strategies studies can use today.
Clinical implications While it is feasible to capture digital phenotyping data from diverse populations, clinicians should consider the degree of missingness in the data before using them for clinical decision-making.
- Schizophrenia & psychotic disorders
- Depression & mood disorders
Data availability statement
No data are available. The code for mindLAMP and data analysis is available at https://github.com/BIDMCDigitalPsychiatry.
This is an open access article distributed in accordance with the Creative Commons Attribution Non Commercial (CC BY-NC 4.0) license, which permits others to distribute, remix, adapt, build upon this work non-commercially, and license their derivative works on different terms, provided the original work is properly cited, appropriate credit is given, any changes made indicated, and the use is non-commercial. See: http://creativecommons.org/licenses/by-nc/4.0/.
Statistics from Altmetric.com
WHAT IS ALREADY KNOWN ON THIS TOPIC
Digital phenotyping methods to gather real-time, longitudinal, behavioural and environmental data from patients’ own smartphone have already been proven feasible and continue to gather great interest for its clinical and research potential.
WHAT THIS STUDY ADDS
The clinical impact of digital phenotyping data depends on the quality of the underlying sensor data. Results from this paper suggest that quality can be high, but requires active engagement and ongoing improvements.
HOW THIS STUDY MIGHT AFFECT RESEARCH, PRACTICE OR POLICY
Careful study design and quality assessments can help ensure this novel digital phenotyping data can deliver more accurate and reliable metrics. New reporting standards and quality metrics will be important for developing digital phenotyping into a more reproducible and scalable method.
Background
The potential of digital technologies for deepening understanding of the aetiology, risk factors and course of diverse health conditions is now well-known.1 Research quantifying the lived experience of those with mental health conditions through capturing real-time information from a myriad of sensors is one of the fast-growing applications of these methods.2 Specifically, using digital phenotyping, the moment-by-moment quantification of the individual-level human phenotype with data from smartphones, it is possible to explore the cognitive, behavioural and symptom domains of mental illness through smartphone data. Research has already emerged on digital phenotyping to understand the risk of suicide,3 relapse in schizophrenia4 and severity of depression.5 As this digital phenotyping research continues to expand, calls have emerged for a new focus on the resolution and psychometrics of these new digital measurements. Yet, understanding the nature of digital phenotyping itself has proven challenging as this method is often employed in a manner that precludes the transparent understanding of the underlying data, processing and feature selection necessary for replicable research.
One under-researched and under-reported area in digital phenotyping work is the quantity of sensor data collection from smartphone devices. Sensors are often set to collect in cycles or at a certain frequency rate. We use the term data coverage to convey the expected quantity of data from a particular sensor as compared with the amount collected. For example, if the digital phenotyping application is set to collect accelerometer measurements at one reading per second (1 Hz), then there should be at least one data point collected in each 1-second interval over time, amounting to just over 1.2 million measurements collected in 2 weeks. Data coverage is rarely, if ever, 100%. Sensor non-collection can occur for multiple reasons including participants turning off data permissions, setting them incorrectly or phone operating systems turning off background data collection for performance/battery reasons. Another challenge is the fact that the Android and iOS permissions required to collect sensor data evolve over time, presenting a moving target. For example, new rules around the low-power mode settings of Android and Apple smartphones mean that if the phone is ever in this mode, then sensor data permissions are likely temporarily revoked. If participants do not actively engage with the application (ie, open it and take a survey), then permissions will likely also be revoked over time. In this work, we sought to investigate data coverage in a combined data set of over 1000 participants collected using the mindLAMP application6 from 2019 to 2022.
Prior work has explored passive data collection by the Beiwe platform.7 8 Kiang et al evaluated accelerometer and Global Positioning System (GPS) data coverage from 211 participants from 6 different studies between 2015 and 2018,7 and Torous et al evaluated data from 16 participants.8 Kiang et al reported missingness of 19% for accelerometer and 27% for GPS,7 which is impressive but may not be possible today in 2023 as sensor data permissions have changed in the 5 years since data were collected for that paper. Except for a slight difference in accelerometer between black and white participants, no significant differences in missingness across race, gender or educational background were reported,8 but they did report a difference in GPS data coverage between Android and iOS users. Another large study with 623 participants using the RADAR platform examining data collected from November 2017 to June 2020 found that only 110 participants had >50% data across all data types collected.9 In addition, the researchers found no link between baseline depression and data availability in their sample, which suggests digital phenotyping methods are applicable regardless of illness severity. The authors concluded more investigation around this data quality is warranted before a more complex analysis is feasible.
Obtaining high levels of data coverage is important because if data collection is sparse, then derived features may be inaccurate. Beyond the impact on features, different data coverage standards and lack of reporting in the literature make studies difficult to reproduce. Heterogeneity in digital phenotyping studies is a problem; for example, a 2022 review of digital phenotyping papers around depression reported such a high degree of heterogeneity that it precluded any quantitative analysis.10 To understand the clinical implications of digital phenotyping data, it is thus critical to ensure any results are not related to missingness completely at random (ie, smartphone application error) or missingness at random (ie, different patients use the application differently), and to explore missingness not at random (ie, certain patients use the application differently).11
This paper has three goals: (1) to present results on the coverage and missingness of passive data collected by the mindLAMP platform6 on a large data set, (2) to explore how poor data coverage can affect features and analysis, and (3) to introduce solutions to maximise the use of digital phenotyping data through increasing coverage of raw data sensor collection.
Methods
Data sets
Appreciating that there are many digital phenotyping platforms, our goal is not to suggest any single one is superior. While our examples derive from the open-source mindLAMP created by our team at Beth Israel Deaconess Medical Center,6 the principles discussed are applicable to any digital phenotyping application that collects sensor data and to any illness or condition being studied.
Patient and public involvement
Patient involvement with the development of mindLAMP is reflected in the co-development of the application6 with all stakeholders before any research was conducted. All mindLAMP studies return data to participants within the application.
We examined data from seven studies conducted by our team in the last 2 years. While the studies differed in their clinical populations (patients with schizophrenia or depression/anxiety; college students with stress/anxiety), they all collected two common digital phenotyping data streams: geolocation (GPS) and accelerometer data. Each study presented participants with a symptom survey at least every 3 days.12–16 All participants in each study (including those who were discontinued for non-adherence to protocol) were included in this analysis. Study details can be found in table 1. The number of participants in each study is listed in table 2.
Study details
Number of participants in each study
Passive data coverage
We define data coverage as the per cent of expected data that were collected. For example, if we expected data to be collected every hour, we would check whether there is at least one data point in every hour of every day. If 23 of the hours had data, the coverage would be 23/24=0.958 for that day. Here, we focus on accelerometer and GPS data. In mindLAMP, the data can be collected continuously at a preset maximum sampling rate. GPS is collected at a maximum sampling rate of 1 Hz and accelerometer is sampled at a maximum rate of 5 Hz. Of course, for various reasons, data are often not captured at these maximum levels. To capture the health-related features that we are interested in, it was not necessary to have data sampled at the maximum frequency. For GPS, we aim to assess the number of significant locations visited each day, so the data sampled must represent each new location. Based on the downsampling experiment described below, accurate information with GPS readings was obtained approximately every 10 min instead of the maximum of one per second. For accelerometer, we computed jerk, the rate of acceleration changes over time, to identify active and inactive periods.
We plotted data coverage for each of our studies for GPS and accelerometer and how data coverage has changed over time. In addition, we calculated the number of days since an activity (ie, survey, mindfulness activity, tip) was completed to investigate the relationship between active engagement with the application and passive data coverage.
Downsampling experiment
To simulate how decreased raw data coverage affects the quality of features derived from these data, we selected the participant at 98% 10-minute GPS data coverage with the highest 1 s data coverage (83%) (see online supplemental appendix A) and iteratively downsampled their data. For example, to generate the 2 s data, we randomly selected one data point in each 2-second interval. The intervals used simulated data collection every 1 s, 5 s, 10 s, 15 s, 30 s, 60 s, 5 min, 10 min, 30 min, 60 min and 4 hours. We then computed home time and entropy on these downsampled GPS data and compared these results with the features derived from the original full data.
Supplemental material
Correlations with passive data
To further illustrate how passive data coverage can affect clinical results, we have presented correlations between passive data features from a study with college students. We calculated correlations between features derived from passive data for all days and for all days where GPS data coverage was above a 50% threshold. As an example, GPS passive data can be used to assess home time and this feature can be correlated against screen duration. Our implementation of these passive data features and data coverage is open source and can be found at https://github.com/BIDMCDigitalPsychiatry/LAMP-cortex.
Results
Data coverage
Realising that data coverage will continue to evolve with smartphone technology, we created violin plots to show the distribution of data across our studies, which is shown in figure 1. Studies 1 and 2 were completed before Fall 2021 and have lower data coverage than more recent studies running on newer versions of the application (p<0.001). As shown in the figure, coverage for accelerometer and GPS is similar. The trajectory of average data coverage across all participants in studies over time is shown in figure 2.
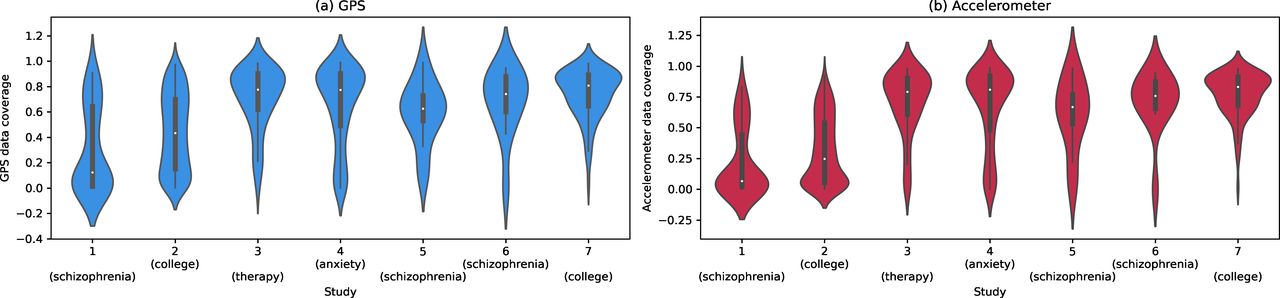
Violin plots of (A) Global Positioning System (GPS) and (B) accelerometer data coverage for each of the seven studies.

Mean data coverage across the studies over time. GPS is shown in blue and accelerometer in red. The shading indicates the 95% CI for the line. GPS, Global Positioning System.
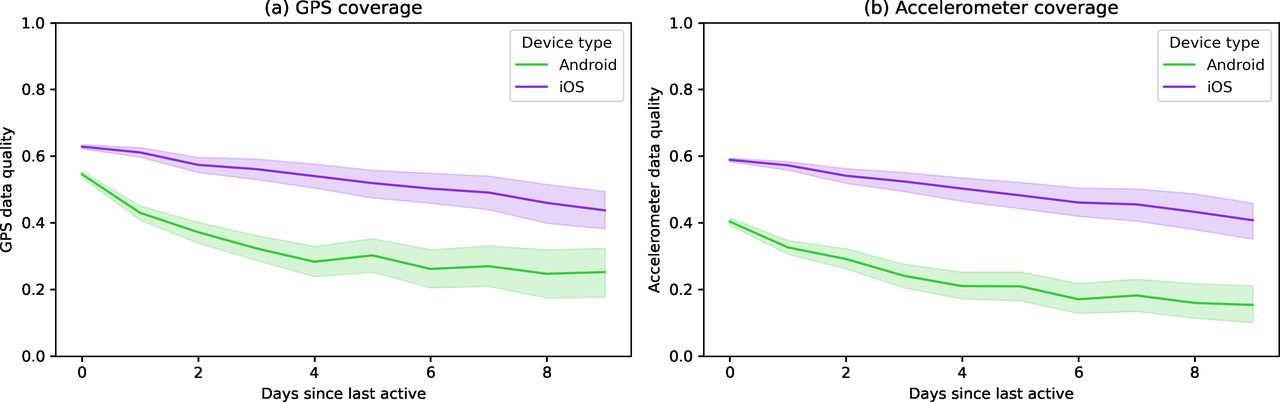
Within any single study, one reason that data coverage may be lower is that after the application has not been used for a certain period of time, the phone’s operating system will halt data collection. This is likely related to battery-saving features enforced by the operating systems of smartphones. When the user completes any activity in the application (eg, a survey, mindfulness activity, viewing their results), this active engagement likely delays the operating system from closing the application. The exact amount of time that must elapse before the operating system halts data collection is not reported by phone manufacturers and differs between phone versions but can be investigated experimentally. To explore this effect, we plotted data coverage by the number of days since any activity was last completed. These curves are shown in figure 3 and appear different for Android and iOS, but both phone types show a downward trajectory with higher variance in data coverage after multiple days of user non-engagement. For example, after 3 days of non-engagement, the average data coverage decreased by 19% for both GPS and accelerometer. When participants did not engage for a week, then data coverage decreased 31% for GPS and 33% for accelerometer. We have split the data by the older (study 1 and study 2) and newer studies in online supplemental appendix B. In both research and clinical terms, this finding highlights the importance of active engagement necessary to collect passive data with maximum data coverage.
Supplemental material

Plot of the (A) GPS and (B) accelerometer data coverage versus the number of days since the participant last interacted with the application. The Seaborn plotting library was used, which generated a shaded 95% CI for the data.18 GPS, Global Positioning System.
Finally, from Tukey’s HSD (honestly significant difference), we found that female participants had significantly higher data coverage than male participants (p<0.05) and that African American participants had significantly lower data coverage than white, Latinx and Asian participants (p<0.01). Moreover, we found a significant correlation between anxiety and GPS/accelerometer data coverage (p<0.01) and between depression and accelerometer data coverage (p<0.05). In addition, age was significantly correlated with accelerometer data coverage for participants over age 22 years (p<0.01). Participants under 22 years were excluded as most participants in the college studies were between 18 and 22 years, making it difficult to compare age and data coverage. Finally, alliance with the application as measured by the Digital Working Alliance Inventory was positively correlated with GPS/accelerometer data coverage (p<0.05, p<0.01).17
Poor coverage and derived features
While passive data can provide insights into a patient’s mental health, if coverage is low, then the features derived from these data may not be accurate and could lead to false interpretations. Figure 4 depicts an illustrative example of this problem using home time. Home time is computed by counting the GPS data points at each location visited by a participant and then finding the amount of time at the location with the greatest number of data points. If GPS sampling frequency is high enough to capture all the locations that a participant visits that day, we will be able to accurately determine the home location as shown in figure 4A. But if the GPS sampling frequency is low, as in the example in figure 4B, then data may not evenly sample visited locations. In this example, the ‘gym’ location was sampled at a higher rate than ‘home’, so the incorrect home location was chosen and home time was greatly underestimated.

A simulated example of how low data coverage can result in inaccurate features. (A) GPS data collected consistently over time, resulting in accurate identification of the home location (blue dots) and correct duration at home (shaded in purple). (B) An example where GPS is not recorded consistently, and where the ‘gym’ location has the most data collected and is incorrectly identified as the home location. GPS, Global Positioning System.
To illustrate this problem with participant data, we performed an experiment where we downsampled GPS data to try to mimic this data missingness. Figure 5 shows how error in the computed home time and entropy begins to increase when points are only sampled every 5–10 min or less.
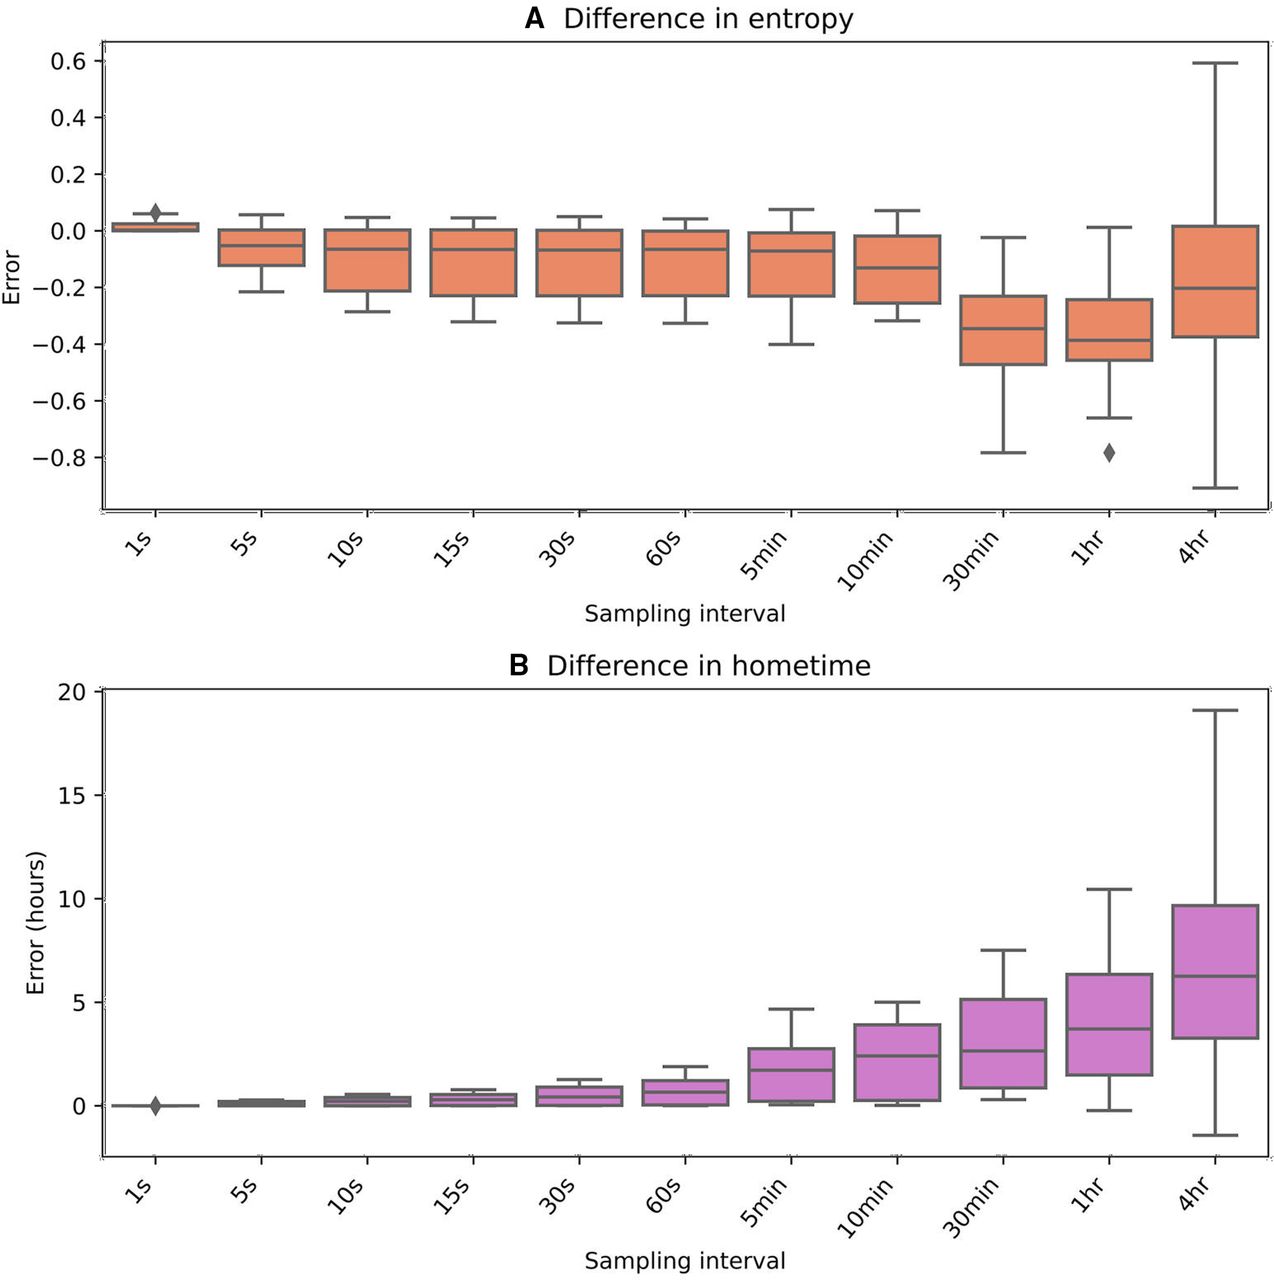
Error from the original feature values when raw GPS data are iteratively downsampled. (A) Absolute error for entropy and (B) error for home time in hours. GPS, Global Positioning System.
When features are inaccurate, this will impact analysis results and clinical interpretations. To highlight this, we produced correlations between passive data-derived features from one of our studies with college students. We used either all days of passive data regardless of data coverage (figure 6A) or only included days with GPS coverage of greater than 0.5 (figure 6B). Three hundred and twenty-one of the 2206 total days of data (14.6%) of the days had GPS coverage of less than 0.5. We can see that the correlations change depending on which passive data are used.
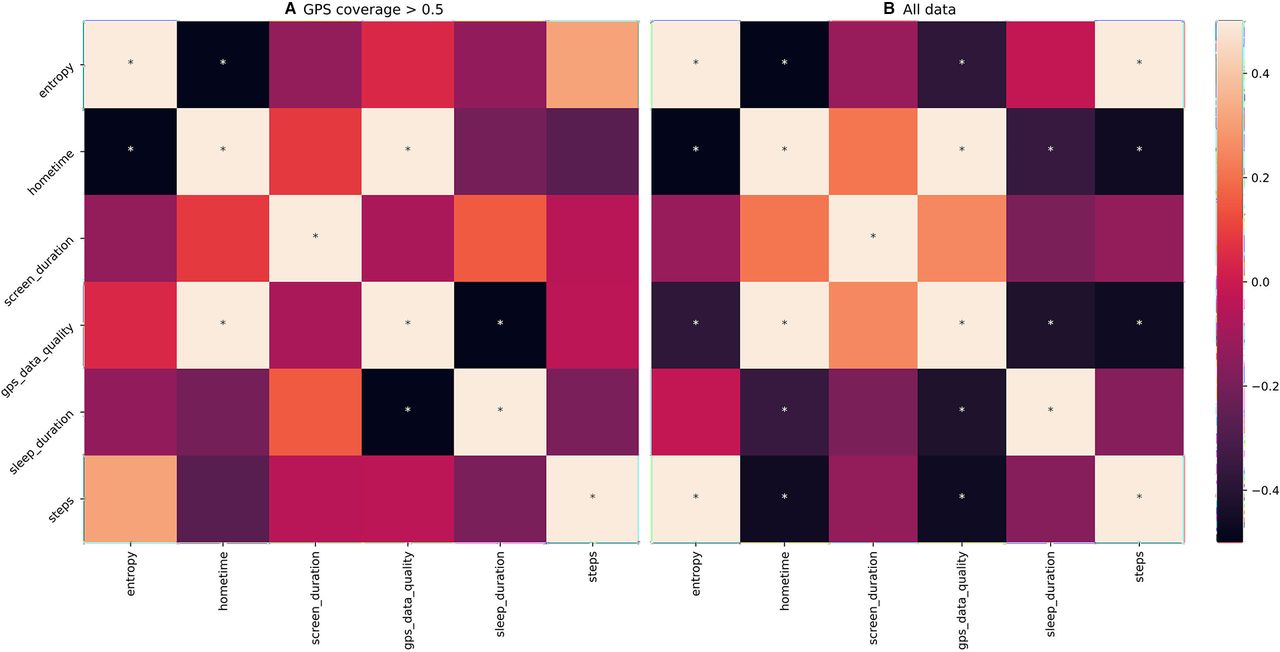
Correlations between the average value of different passive data features using (A) only days of data where GPS coverage is greater than 50% and (B) all data (regardless of data coverage). Significant correlations (p<0.05) are marked with an asterisk (*). GPS, Global Positioning System.
Suggestions
Digital phenotyping research requires careful consideration to maximise data coverage. Solutions include recruiting additional participants12 to increase the chance of higher data coverage and study protocols designed to maximise data coverage from enrolled participants. While imputation methods can also help address some issues related to missingness18 after data collection, solutions to maximise data coverage are the focus of our recommendations.
It is important to consider the reasons for low data coverage and design protocols to minimise them. One consideration is to ensure participants maintain active engagement with the application so that passive data coverage is maximised (see figure 3). This may include asking participants to complete surveys in the application, view their results or complete any other activity with some level of frequency. A second consideration is to work with participants to minimise the times their phone enters low-power mode. Some phones may even stop passive data collection if the phone is off and motionless. A third consideration is to ensure the participants have set the appropriate application permissions and not revoked sensor permission by mistake.
Considering these challenges, we present several practical methods our team has employed that are broadly applicable across any digital phenotyping application or study. These include (1) run-in periods, (2) education and hands-on support, and (3) tools to easily monitor data coverage.
Run-in periods are common in pharmaceutical studies and also have applicability for digital phenotyping. For example, in our second study on college students’ mental health, we introduced a 3-day run-in period before participants could enter the study. During this time, participants completed a survey with one to two questions each day, and accelerometer and GPS data collection was monitored. Only participants who were able to complete the surveys each day and achieve a minimum threshold of data collection were able to enter the study.
Like any study, participant education and hands-on support can be useful. For example, in our studies using mindLAMP to augment therapy for depression and relapse prediction for schizophrenia, we included patient education with Digital Navigator support at the beginning of the study.19 A Digital Navigator acts as a coach and can reach out to help troubleshoot low data coverage by assessing and addressing common issues (eg, incorrectly set sensor permissions).
Another useful approach is to employ tools and procedures that make it easy to monitor passive data quality in near real time.20 As an example, we have created interactive visualisations on the data portal of our researcher dashboard14 to allow study staff or clinicians a simple way to track participant data. These graphs are automatically updated each day and contain information about data coverage (as shown in figure 7), passive features and active data. The code to generate these graphs is open source and can be found at https://github.com/BIDMCDigitalPsychiatry/LAMP-cortex. These graphs can be used to identify participants requiring help with data coverage and also shared directly with participants to prompt more active engagement with the application.21

A sample graph for researchers and clinical staff showing data coverage for all participants for a study. Each box is coloured based on the participant’s status: red for bad (data coverage <50%), yellow for okay (data coverage between 50% and 80%) and green for good (data coverage >80%). For device state, data quality was considered good if there was at least one data point per day, bad otherwise. GPS, Global Positioning System.
Many prior works have recruited people interested in using one type of device and fewer studies support both Android and Apple smartphones. Like prior papers,7 we found some differences between Apple and Android groups but did not find a high degree of bias in our studies. We also found some differences in data quality across gender and race, which should be further investigated. Online supplemental appendix C shows data coverage across phone types and operating system versions. As there was a large variety in our studies, it is difficult to determine whether specific phone types or operating systems should be excluded. Online supplemental appendix D shows two tables with data coverage results for different genders, races, ethnicities and illness severities in our studies. There may be a relationship between participant alliance with the application and data quality (online supplemental appendix E). For example, participants who feel a greater alliance may be more motivated to complete activities, and we have shown that increased active participation leads to better passive data coverage. However, the relationship between alliance and engagement is complicated.22
Supplemental material
Supplemental material
Supplemental material
Supplemental material
Supplemental material
Supplemental material
Supplemental material
Supplemental material
Combining these methods and focusing on data coverage can lead to positive results. The upward trajectory of data coverage as shown in figure 2, especially the increases in Fall 2021, coincides with the implementation of the strategies discussed above.
Discussion
In this paper, we discuss the potential, challenges and solutions for using smartphone passive data for research or care. Our results shared suggest that while it remains highly feasible to obtain a high degree of passive data coverage, this is likely only possible with multiple concerted active efforts designed to ensure ongoing data coverage.
The results shared in this paper also help explain why many smartphone-sensing studies have been challenging to replicate. The likely high degree of variance in raw passive data coverage obtained in different studies suggests that the derived features may not be truly comparable. Given this heterogeneity is related to both the smartphone operating systems as well as the degree of active engagement by each participant with the application, any efforts at replication may be impossible today as few studies report on active application engagement at an individual level. This suggests the clear need for a system of reporting standards that include information on the smartphone operating system, metrics of active engagement and resulting data coverage metrics to transform passive data-derived features into clinically meaningful insights.
Creating standards will not be simple. Given the nature of this work, stakeholders must include technology manufacturers that control the operating systems, clinicians/researchers seeking to use the data, and patients who must both engage with such systems and ultimately derive value from them. While such standards are not yet in place, our results can still inform how clinical studies using these methods are both designed and supported. Still, even our proposed solutions present challenges. Run-in periods may improve data coverage by excluding those not able to meet minimum thresholds, but today we have little information on which types of people may be excluded as a result. The potential for a high degree of data coverage versus biased results must be considered. Monitoring for bias is thus critical. Digital Navigators and data monitoring with dashboards are promising approaches to further increase data coverage,21 but need to be budgeted into study designs or clinics. Likewise, as the operating systems of smartphones continue to evolve, so must applications generating these data, which means that infrastructure budgets need to be reframed from single-time expenses to supporting ongoing maintenance.
There are several limitations of this work. First, the downsampling experiment did not have ground-truth estimates of home time or entropy. However, we still feel that these experiments are valuable in demonstrating how passive data feature estimates can change dramatically if data coverage is low. In addition, we did not have a control group for the data monitoring strategies presented, which makes it difficult to determine whether these techniques are the sole cause of the improvements we have seen. Future work should also further focus on attempting to discern missingness at random, missingness completely at random and missingness not at random.
In summary, the potential of smartphone passive data to generate new research and clinical insights into behaviour and illness remains high. However, low data coverage of passive data can lead to derived features that are inaccurate and misleading. Active engagement strategies that can increase data coverage reporting will further increase the reproducibility of this work.
Data availability statement
No data are available. The code for mindLAMP and data analysis is available at https://github.com/BIDMCDigitalPsychiatry.
Ethics statements
Patient consent for publication
Ethics approval
This study involves human participants. Each study received IRB permission from BIDMC (#2017P000359, #2019P001140, #2020P000310, #2020P000956)and all participants signed written IRB informed consent.
Acknowledgments
Research assistants who helped run these mindLAMP studies and the people who partook as participants.
Supplementary materials
Supplementary Data
This web only file has been produced by the BMJ Publishing Group from an electronic file supplied by the author(s) and has not been edited for content.
Footnotes
Twitter @JohnTorousMD
Contributors JT and DC contributed equally to this article. JT is guarantor.
Funding Wellcome Trust (WT215843/Z/19/Z), National Institute of Mental Health (K23MH116130) and Sydney Baer Jr Foundation.
Competing interests JT is a scientific advisor for Precision Mental Wellness.
Provenance and peer review Not commissioned; externally peer reviewed.
Supplemental material This content has been supplied by the author(s). It has not been vetted by BMJ Publishing Group Limited (BMJ) and may not have been peer-reviewed. Any opinions or recommendations discussed are solely those of the author(s) and are not endorsed by BMJ. BMJ disclaims all liability and responsibility arising from any reliance placed on the content. Where the content includes any translated material, BMJ does not warrant the accuracy and reliability of the translations (including but not limited to local regulations, clinical guidelines, terminology, drug names and drug dosages), and is not responsible for any error and/or omissions arising from translation and adaptation or otherwise.