Article Text

Abstract
Objective This study aimed to understand the attributes of popular apps for mental health and comorbid medical conditions, and how these qualities relate to consumer ratings, app quality and classification by the WHO health app classification framework.
Methods We selected the 10 apps from the Apple iTunes store and the US Android Google Play store on 20 July 2018 from six disease states: depression, anxiety, schizophrenia, addiction, diabetes and hypertension. Each app was downloaded by two authors who provided information on the apps’ attributes, functionality, interventions, popularity, scientific backing and WHO app classification rating.
Results A total of 120 apps were examined. Although none of these apps had Food and Drug Administration marketing approval, nearly 50% made claims that appeared medical. Most apps offered a similar type of services with 87.5% assigned WHO classification 1.4.2 ‘self-monitoring of health or diagnostic data by a client’ or 1.6.1 ‘client look-up of health information’. The ‘last updated’ attribute was highly correlated with a quality rating of the app although no apps features (eg, uses Global Positioning System, reminders and so on) were.
Conclusion Due to the heterogeneity of the apps, we were unable to define a core set of features that would accurately assess app quality. The number of apps making unsupported claims combined with the number of apps offering questionable content warrants a cautious approach by both patients and clinicians in selecting safe and effective ones.
Clinical Implications ‘Days since last updated’ offers a useful and easy clinical screening test for health apps, regardless of the condition being examined.
- anxiety disorders
This is an open access article distributed in accordance with the Creative Commons Attribution Non Commercial (CC BY-NC 4.0) license, which permits others to distribute, remix, adapt, build upon this work non-commercially, and license their derivative works on different terms, provided the original work is properly cited, appropriate credit is given, any changes made indicated, and the use is non-commercial. See: http://creativecommons.org/licenses/by-nc/4.0/.
Statistics from Altmetric.com
Background
While health apps offer the potential to augment care for mental health as well as common comorbid medical conditions like hypertension and diabetes, surprisingly little is known about their functionality, uptake or impact on health. The scarcity of information on apps derives from the developer companies that do not share such information, the lack of standards for collecting data across health apps and the absence of healthcare regulation for these apps. Many apps that appear as healthcare-related tools state in fine print that they are wellness, not actually health tools, in an effort to circumvent healthcare regulation and reporting. Still, interest in apps remains strong despite challenges in identifying appropriate mental health,1 diabetes2 and hypertension apps.3
As regulatory bodies like the US Food and Drug Administration move towards new models of evaluating healthcare apps with the Digital Health Software Precertification (Pre-Cert) Program, which moves regulatory efforts towards ‘real world performance’,4 there is an urgent need to understand the ‘real world’ state of apps today. Specifically, it is important to understand what types of apps are being used and what we can learn about them from ‘real world’ data. The question is more important, as evidence suggests that many patients today are interested in health apps and up to 58% may have downloaded a health app at some point.5 While interest or even downloads of health apps does not necessarily equate to use, it does suggest that clinicians are likely to be asked about apps or experience patients using them today.
Smartphones’ ability to offer a myriad of features and functions is evident from the research literature. From apps that collect smartphone sensor data that researcher can use to predict relapse in schizophrenia6 to others used to monitor heart conditions in real time,7 the potential of apps across healthcare is vast. However, the majority of apps featured in the research literature are often not available to the public.8 Given that many users find apps by searching the top returned results in the app marketplaces, it is important to understand the functionality of these apps that the public is presented with. While there is no official count for how many healthcare-related apps exist, market researchers have claimed over 300 000 and over 10 000 related to mental health.9 Thus, it is impossible for any clinician (or patient) to remain aware of all health apps. It is more practical to focus on those most likely to appear early in search results. In an effort to help standardise communication around digital health in a landscape with hundreds of thousands of apps, in early 2018, the WHO released its ‘Classification of Digital Health Intervention V.1.0’, which it describes as a shared language to describe the uses of digital technology for health.10
Concern for the lack of quality of these apps is common across all fields of healthcare. One review paper of apps for cancer survivors noted: ‘in the press to get apps to market, basic developmental and incremental testing steps have been skipped in the majority of cases’.11 Reviews of mental health apps for both children and adults have noted a similar lack of evidence or adherence to the clinical recommendation.12 13 Although there is some evidence that there is a correlation between star rating of an app and its number of downloads,14 generally little is known about why some health apps become popular and others not. Furthermore, researchers have demonstrated that the number of stars or number of downloads on app marketplaces does not correlate with clinical utility or validity for all apps including mental health apps.15 Ideally better features and functionality would drive popularity, but research on popular blood pressure apps suggests that those offering inaccurate and ‘falsely reassuring’ low numbers were top rated, presumably because people liked being told that they were healthy.16 A popular mindfulness app with five stars and half a million downloads was found to be no better than a placebo version of the app,17 raising further questions about rating metrics.
Objective
In this paper, we sought to explore the functionality and attributes of popular apps and how they may relate to the apps’ popularity reflected in consumer rating metrics, the apps’ use as classified by the WHO framework and the apps’ quality assessed by consensus among the authors. By looking across different diseases states, with a focus on mental health, we sought to understand if trends in app functionality, attributes, popularity, use and quality are specific to medical fields or common across disciplines.
Methods
We selected the top 10 apps from the US Android Google Play stores and the top 10 Apple iTunes store on 20 July 2018 across six disease states: depression, schizophrenia, addiction, hypertension, diabetes and anxiety. Each app was downloaded and used by two independent coders who provided an evaluation of each app based on the app store description and using the app for at least 10 min. Raters were asked to fill in a code book for each app and provide information on the app attributes (eg, days since last update, cost and privacy policy present), functionality for gathering data (eg, surveys, Global Positioning System (GPS) and diaries), returning information and engaging the user (eg, notifications, badges and health tips), measures of the apps’ popularity (eg, stars and number of downloads), medical claims and scientific backing, and classification of app functionality using the WHO classification framework. Metrics were selected with the goal of being objectively assessed and readily accessible. Thus, metrics like ‘usability’ were not included as they will vary between users based on their health and technology literacy. This is not to diminish the importance of usability but rather recognise that no set of objective metrics or scores can perfectly match the right app to the right patient, and it is critically important to also consider personal factors when matching a patient to an app. For metrics selected, we assessed the presence rather than the quality of the metric. For example, we assessed whether a privacy policy was present but not did evaluate its quality.
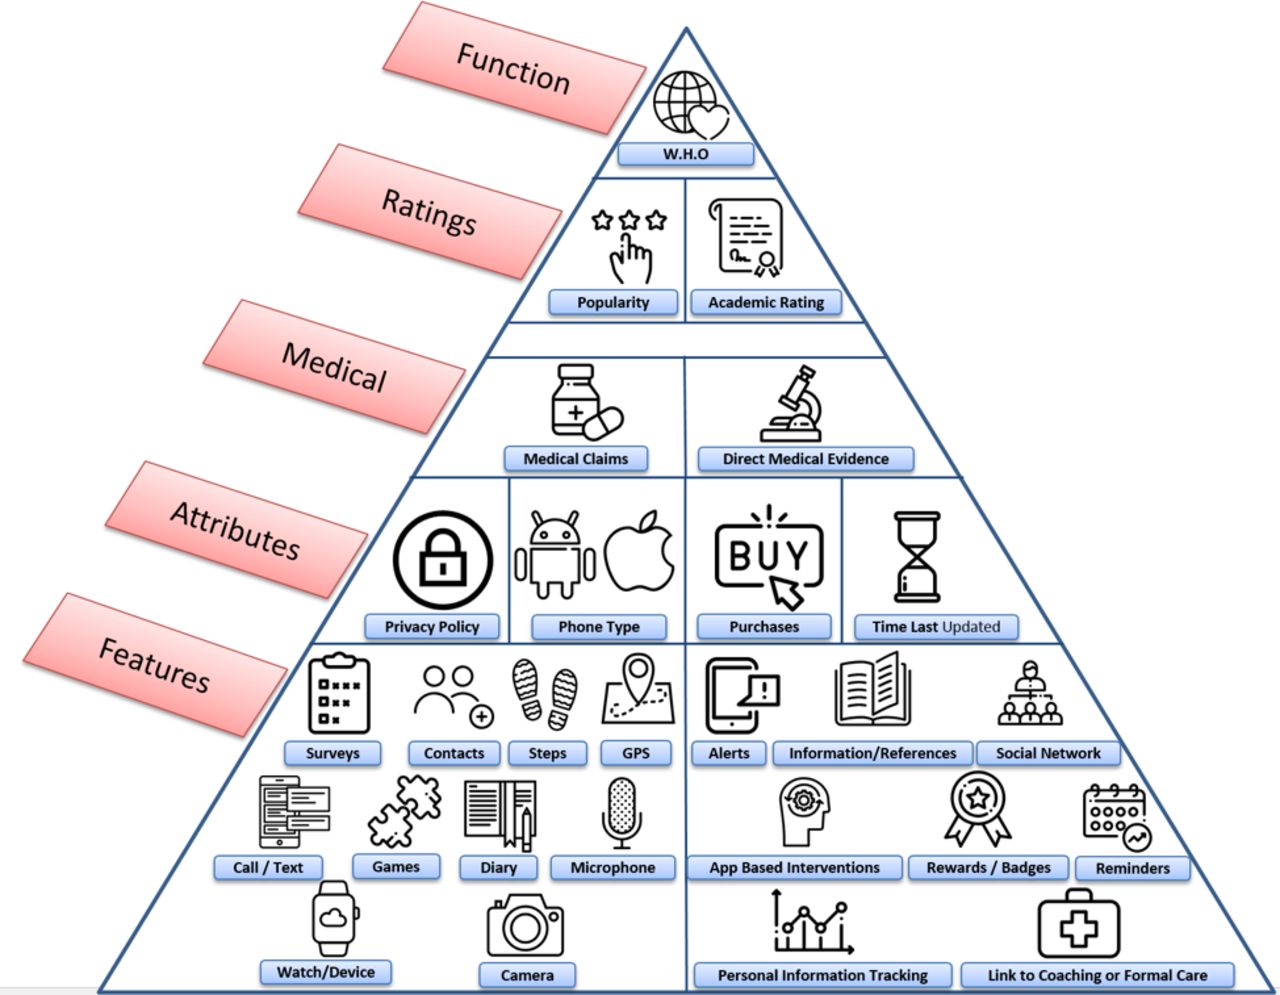
A schematic of how apps were evaluated is presented in figure 1. While we do not imply a hierarchy among features, attributes, medical claims, ratings or functionality metrics, the figure may offer a useful tool to contextualise some of the many metrics that can be considered in app evaluation.
One potential representation of various app metrics that were evaluated in this study.
Raters provided links to each app, which were checked by the senior author to ensure the appropriate app was being evaluated. All differences between coders were resolved through consensus between both coders with at least one other coder present.
Realising that there is no gold standard metric for health app quality, we rated quality on a three-point scale. While prior studies have used 10-point scales to assess quality,15 we felt that a simpler scheme of (a) ‘serious concerns regarding safety’, (b) ‘appears acceptable’ and (c) ‘may be useful or offer more features than other similar apps’ offers higher validity, though still subjective in nature. Any apps that raised concern about the safety of the user were rated as ‘serious concerns regarding safety’ (eg, apps that installed malware on the user’s phone, apps that promise brain changes after listening to music and so on). Apps that did not raise safety concern, but did not appear useful or provide support for its efficacy were rated ‘appears acceptable’. Any app that did not raise safety concerns and appeared to provide evidence or additional features compared with other apps were rated as ‘may be useful or offer more features than other similar apps’. All scores for quality of apps were reached by consensus between five of the authors (NH, AV, JT, PH and HW) in an effort towards greater reliability. However, we only used the ‘serious concerns regarding safety’ category in the analysis given its validity is easier to support.
We treated both star rating and three-tier author quality metrics as continuous variables, and given the number of variables (17 features, 4 attributes, medical claims/data) for each of the 20 apps across the six diagnoses, we implemented variable selection using the Lasso method to obtain sparser and more interpretable models. We thus performed regression on all the features and attributes mentioned above separately within each disease state using a  penalty with the number of ratings as weights. The weights were top-coded at 1000, that is, the number of ratings >1000 were replaced by 1000 as the ratings of apps with this many scores were considered reliable. The corresponding Lasso tuning parameter was selected by fivefold cross-validation. Due to the small sample size, the tuning parameter likely will vary greatly between repetitions. Thus, in order to mitigate the randomness of the tuning parameter between repetitions, we repeat the procedure 100 times and count the frequency of selected features, attributes and medical claims/data.
Findings
We examined a total of 60 Apple and 60 Android applications. Thirty-eight of the Apple apps had an Android equivalent and 25 of the Android apps and an Apple equivalent. The number of overlapping apps was not the same for each type of phone as the top 10 recent apps on the respective app marketplaces did not perfectly overlap.
Attributes of the apps are shown in the first four rows of table 1. Medicinal claims made by apps, as perceived by raters, and evidence to support those claims as specific to the app are shown in the last two rows of table 1.
App star ratings, attributes and medical claims/data by target disease
Apps were also rated for quality based on the three-point system outlined in the methods section. Of the 120 apps, a total of 35 were rated as ‘serious concerns regarding safety’ by the discussion of five of the authors (NH, AV, JT, PH and HW), meaning these apps had concerning red flags for use with patients. Select examples of such red flags include a schizophrenia app that was a game where the user bounces medications around the screen with the goal of not losing their medication and thus sanity, another schizophrenia app that promises structural brain changes after listening to special music, a diabetes app that appears to install malware on user’s smartphone, several blood pressure apps that refer users to out of date and incorrect blood pressure targets, and an addiction app that contains a click through 12-step programme that can be completed in 1 min.
Apps used various features to gather data, return information and engage users. The percentage of apps utilising certain features is reported below in table 2. The features associated with gathering data are presented with (in) and the features associated with returning information or engaging users are presented with (out).
App Features by Target Disease
Apps were coded according to the WHO classification. Because an app may have multiple functions, we only report on the most frequently assigned codes. For all categories of apps except schizophrenia and hypertension, the most frequently assigned code was 1.4.2, ‘self-monitoring of health or diagnostic data by a client’. For schizophrenia and hypertension, the most frequently assigned code was 1.6.1, ‘client look-up of health information’.
Our regression models for both user and author app ratings produced complex models that weighted certain app features or attributes with positive or negative values, depending on whether they were correlated with higher or lower app ratings, respectively. These models were complex and did not meet our goal of being easily applicable to a busy clinician seeking to learn more about an app. However, using the methods outlined above, we were able to identify individual attributes and features that were associated with user scores and author quality metrics.
In our model, the ‘last updated’ attribute was selected consistently across all disease states and both number of stars and the authors’ ‘‘serious concerns regarding safety’’ rating. Thus, we conducted more rigorous statistical testing using a cut-off of 180 days since the last update. We examined the significance of a variety of cutoffs and found 180 to be where the correlation laid between days since updated and app rating. Apps updated in the prior 180 days were associated with higher user star ratings (χ2 test, p=0.0132) and those apps not updated in the last 180 days were associated with being rated ‘‘serious concerns regarding safety’’ by the authors (two-sided t-test, p=0.0131). This result remained significant when apps also were not weighted by the number of reviews.
Discussion
Clinicians and consumers seeking health apps are faced with apps that are highly heterogeneous in terms of features, attributes and quality. While we were not able to define a core set of app features that consistently indicated a higher quality app, we did identify a recent app update to be associated with positive consumer ratings and a non-recent update to be associated with our ‘serious concerns regarding safety’ rating.
This ‘days since last update’ correlation with quality rating offers a useful clinical screening test for apps. By quickly checking if an app has been updated in the last 6 months, clinicians may be able to steer patients away from more dangerous apps. The reasoning behind this recommendation is apparent from our results of blood pressure apps, which on average were updated 687 days ago. Because of such infrequent updates, these apps no longer offer accurate information reflected in changing guidelines, such as the November 2017 change in target blood pressure.18 A longer duration without updates also suggests that an app is no longer being maintained and may be what is known as a ‘zombie app’—alive in its availability but dead in terms of updates and support. While checking any app for days since the last update is useful, it should only be considered a screening test based on current results from our study. Because app developers who become aware of this screening process could meaninglessly update their apps to promote its usage, it is important to consider that this is not a foolproof metric, but an easy way to eliminate potentially harmful apps. App assessment is a complex process best considered in the context of an individual patient, particular app and clinical needs—a policy affirmed by the American Psychiatric Association’s app evaluation framework.19 To further our understanding of app assessment, days since the last update should be looked at between the six disease states, Apple and Google platforms and app features in order to further understand the relationship between app type, rating and update frequency.
Our results also suggest high heterogeneity in terms of attributes and features across apps for different conditions. Across all six conditions examined, apps for schizophrenia and hypertension appeared most concerning. These apps had the lowest percentage of privacy policies present, 50% and 45%, respectively, and the lowest percentage of users’ ability to delete data, 20% and 25%, respectively. While none of the apps we examined had Food and Drug Administration-marketing approval to make medical claims and only a few had scientific backing, nearly 50% of those for depression, diabetes and hypertension made claims that could be interpreted as medical. Therefore, helping patients understand what apps can do and what they cannot is an important and evolving role for clinicians.
We also found high heterogeneity across and within disease categories while classifying features used to collect data, return information and engage users. While much research today focuses on passive data involving smartphone sensors, like GPS or call/text logs, to infer behaviour or health status, we found that apps today infrequently use phone sensor data and instead rely on active data entry, like surveys and diaries. While 60% of diabetes apps we examined supported integration with external devices (often glucometers), most health apps did not support any wearable (eg, smartwatch) or external device integration. Notifications and presenting summarised data to provide trends or insight were the most common features apps used for returning information to users. While different apps offered different combinations of features, we found no simple relationship between these features and any quality measures. This suggests that the features themselves may be less important than their implementation in any specific app. This may also explain why so many health app rating systems have struggled with validity or providing meaningful information, as the quantifiable aspects of apps may have less significance when viewed in isolation.
Although the WHO classification scheme offers the potential to better categorise apps by functionality, and thus clinical purpose, we found it ineffective because most apps perform the same primary functions. Although there are numerous functionalities that apps can perform, 87.5% (105/120) of the apps were classified as 1.4.2: ‘self-monitoring of health or diagnostic data by a client’ or 1.6.1 ‘client look-up of health information’. This suggests a need to expand the WHO framework to include detailed classifications within these categories, as well as the potential for smartphone apps to expand to new functionalities and features.
Our results are in line with prior research. A recent review on criteria of assessing the quality of mHealth (mobile health) apps concluded: ‘There will never be a complete and perfect mHealth app assessment criteria because these criteria must apply to apps that are changing in development continuously’.20 A Canadian-based effort that gathered diverse mental health stakeholders, including patients, noted that they were not able to find a single scale or framework that adequately addressed their needs.21 Prior efforts to create repositories of higher quality apps have failed at the national level22 when closely scrutinised and other efforts to score apps by features have also been found to be unreliable23 when closely examined. Furthermore, several of our findings have been supported by the software engineering literature as well, including the correlation between days since last update and app ratings and the number of unsupported claims made by apps.14 This suggests that research collaboration between the healthcare and software engineering fields could help to further our knowledge of app functionality and effectiveness. Therefore, future work should aim to expand on the features we examine by including the software trends of these apps.
Like all studies, ours has several weaknesses. Although we examined 120 apps, there are hundreds of thousands of health apps. By selecting the apps users are most likely to find, we believe our results are clinically useful, but they may not be generalisable. We also created our own app quality scale, but only used such in the analysis for ‘serious concerns regarding safety’ classification of apps, which we believe both clinicians and patients would want to avoid. We chose not to analyse results for apps we rated as average or above average due to concerns regarding validity. Finally, we acknowledge that although we had two reviewers use each app and reach consensus for every element rated, it is likely some ratings are incorrect. This is a real life challenge associated with any app evaluation effort where no gold standards exist. The features and attributes we examined here are not a substitute for appreciating patient preferences, usability and other personal factors necessary to consider when picking an app.
Clinical Implications
Health apps offer potential for mental health, but currently are heterogeneous in terms of features, attributes and quality. Our results do not offer a panacea for selecting better apps but suggest that assessing days since the app was last updated may be a useful screening question to quickly eliminate apps that are likely unhelpful or even dangerous. Although any app may offer benefit to the right patient, the vast majority continue to have no scientific evidence to support their use. As the digital health field evolves, the quality and utility of these apps will improve, but until then we suggest careful consideration in evaluating apps for use in care.
Acknowledgments
JT is supported by a career development award from the NIMH K23MH116130-01. GL is supported by a Harvard Data Science Initiative award and the BIDMC Department of Psychiatry. JPO is supported by an award from the NIH 1DP2MH103909.
Footnotes
Contributors HW and JT: formulated the study plan. HW, JT, AV, PH and NK: conducted the data gathering and coding. JT, GL and J-PO: conducted the analysis. All authors drafted, edited and approved the final manuscript.
Funding The authors have not declared a specific grant for this research from any funding agency in the public, commercial or not-for-profit sectors.
Competing interests None declared.
Provenance and peer review Not commissioned; externally peer reviewed.